This evaluation of a 1-Hour Data Visualization Principles Workshop reveals insights about participant learning and provides critical guidance for future workshop development.
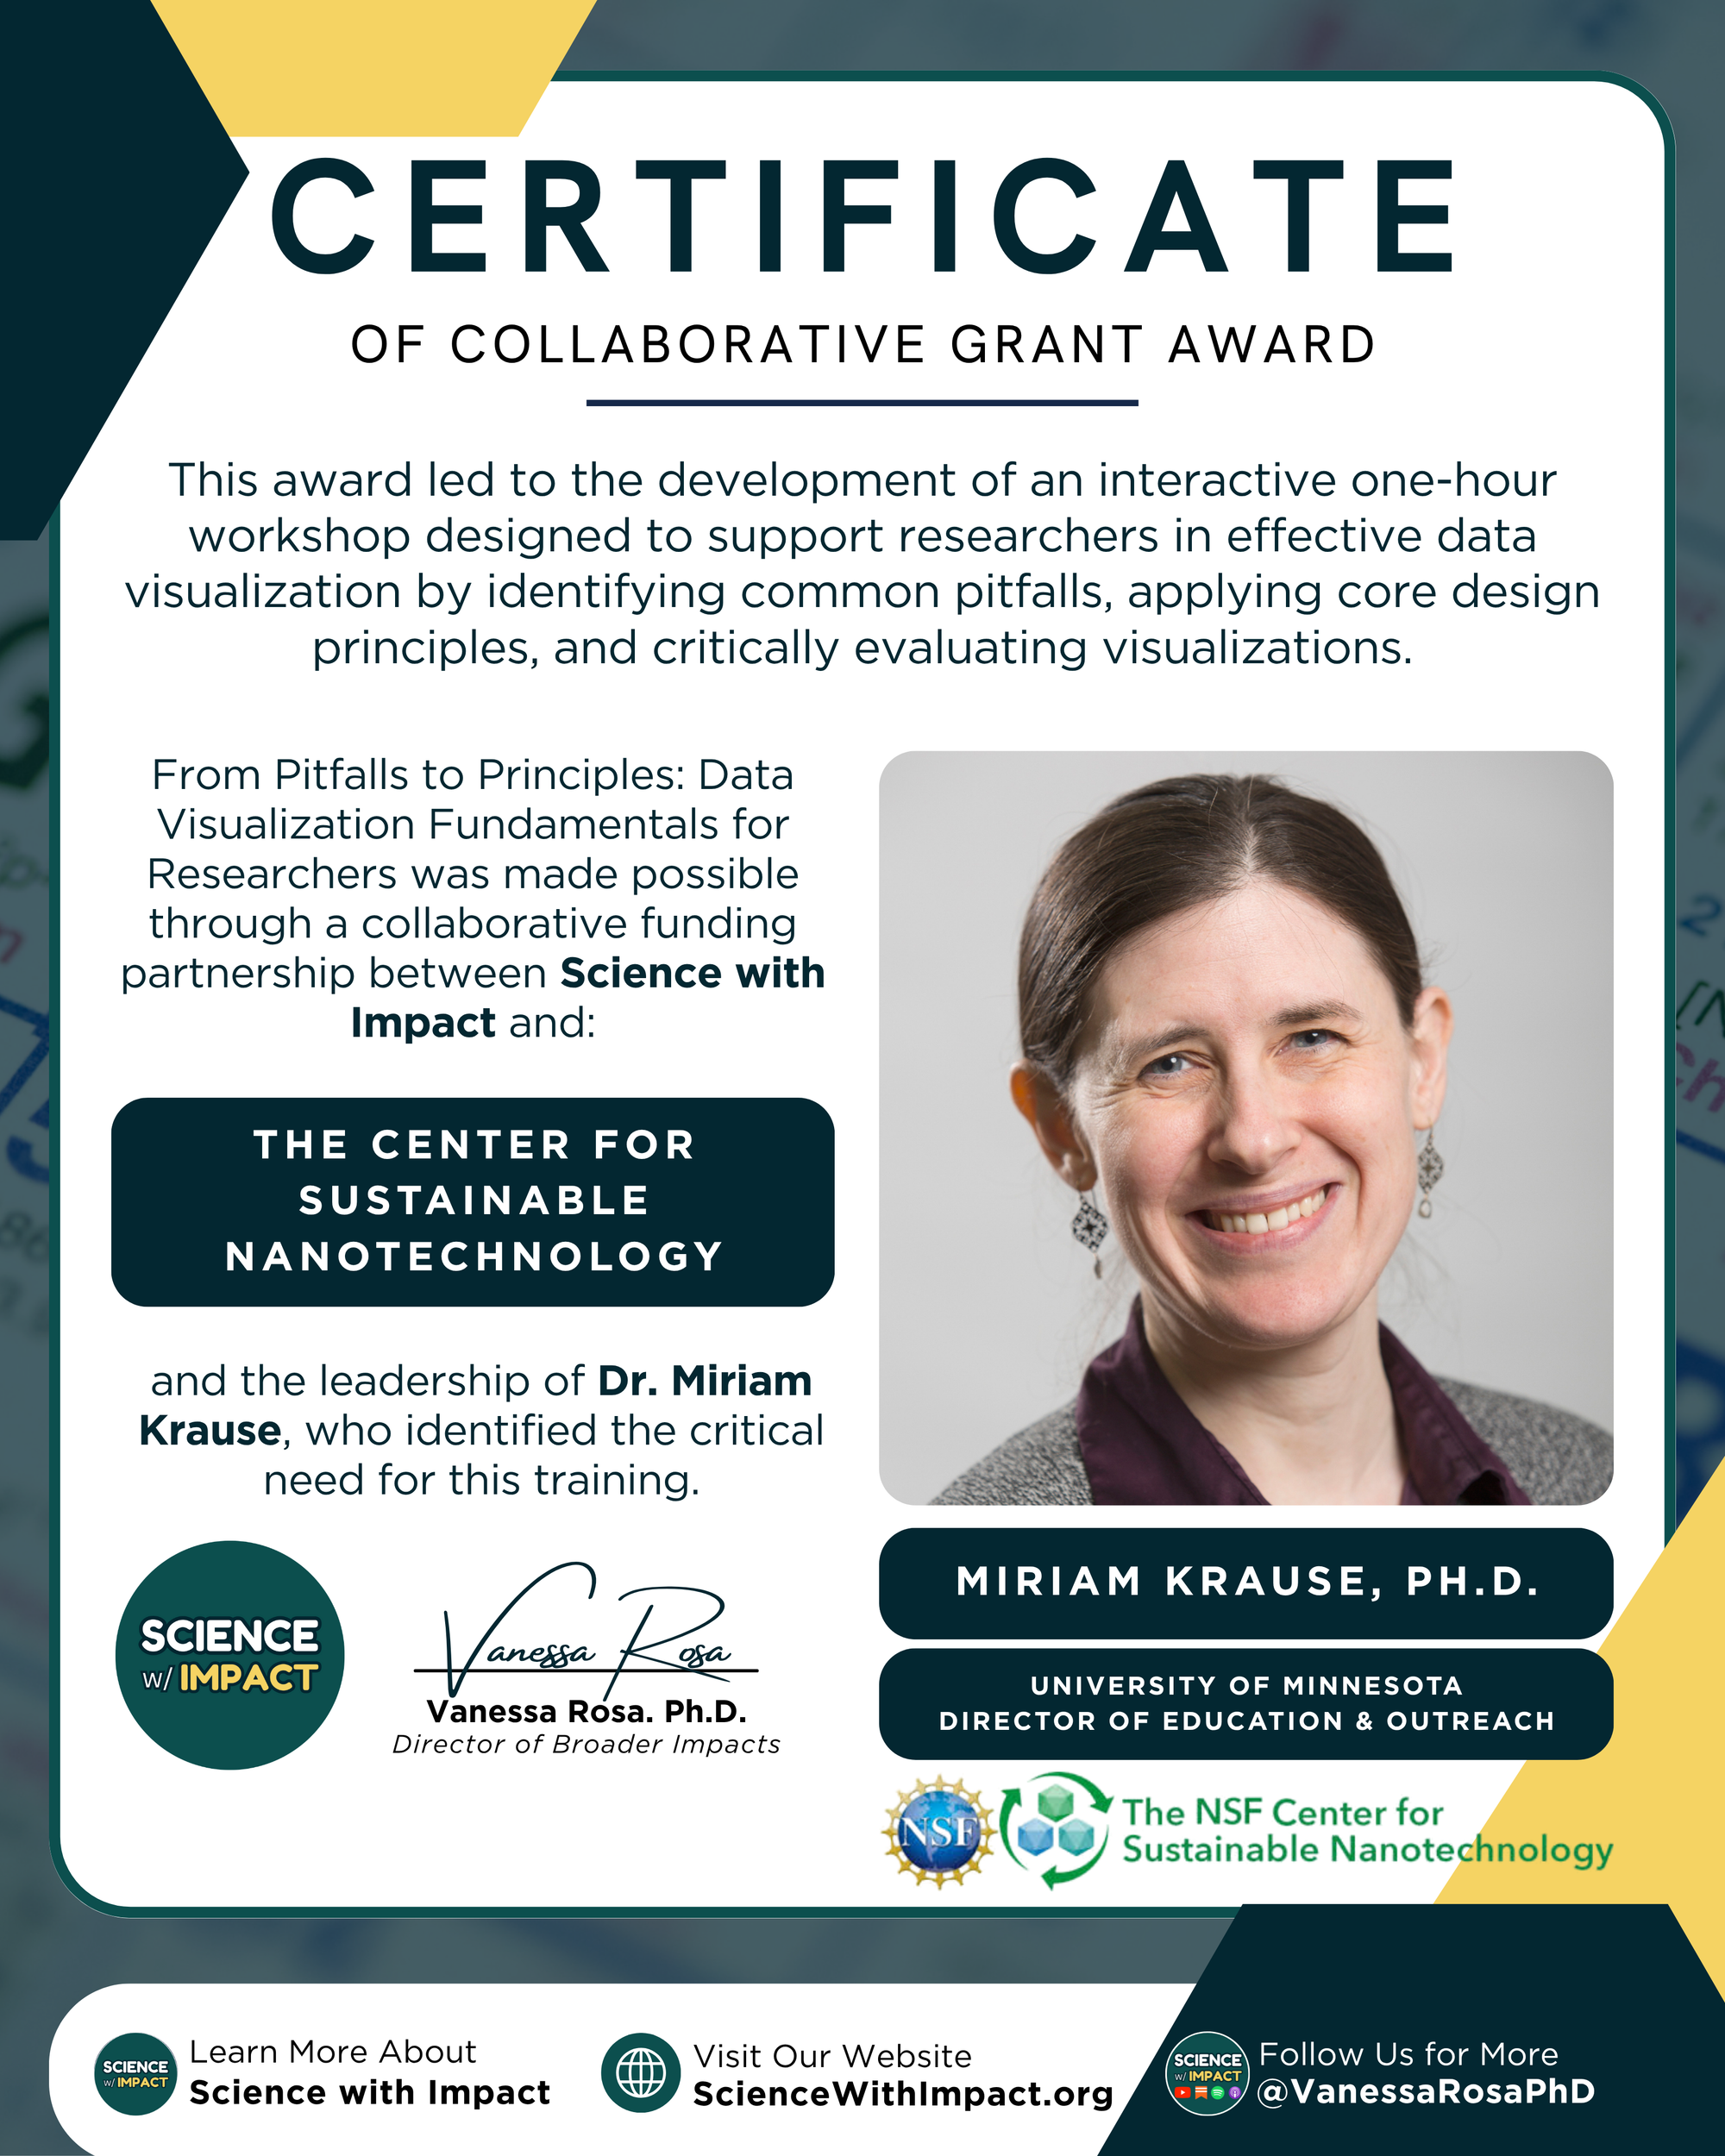
This workshop was the result of a shared-cost grant awarded by our nonprofit, Cuvette Empowered, to Miriam Krause, M.S., and the NSF Center for Sustainable Nanotechnology.
Our Objective
By the end of the 1-hour interactive workshop, we aspired to:
- Improve undergraduate researchers' self-reported familiarity with data visualization principles, and
- Ability in identifying common data visualization pitfalls, applying core design principles to evaluate and improve visual representations of research data, and critically assessing the impact of visualizations on effective communication and scientific credibility.
Impact Summary
Applying Dr. Rosa's SDD Framework for evaluating the broader societal impacts of STEM research:
The Data Visualization Principles Workshop engaged 11 participants over 1 hour, and five responded to the post-survey (response rate exceeding 45%), providing a measurable average improvement of 0.4 points on a 5-point competency scale in practical visualization skills. Velocity calculations (v = Δx/Δt) indicated a rate of 0.10 depth units per hour; momentum (p = mv) was measured at 0.5 scale-depth units. The velocity of 0.10 depth units per hour shows measurable learning within the limited timeframe.
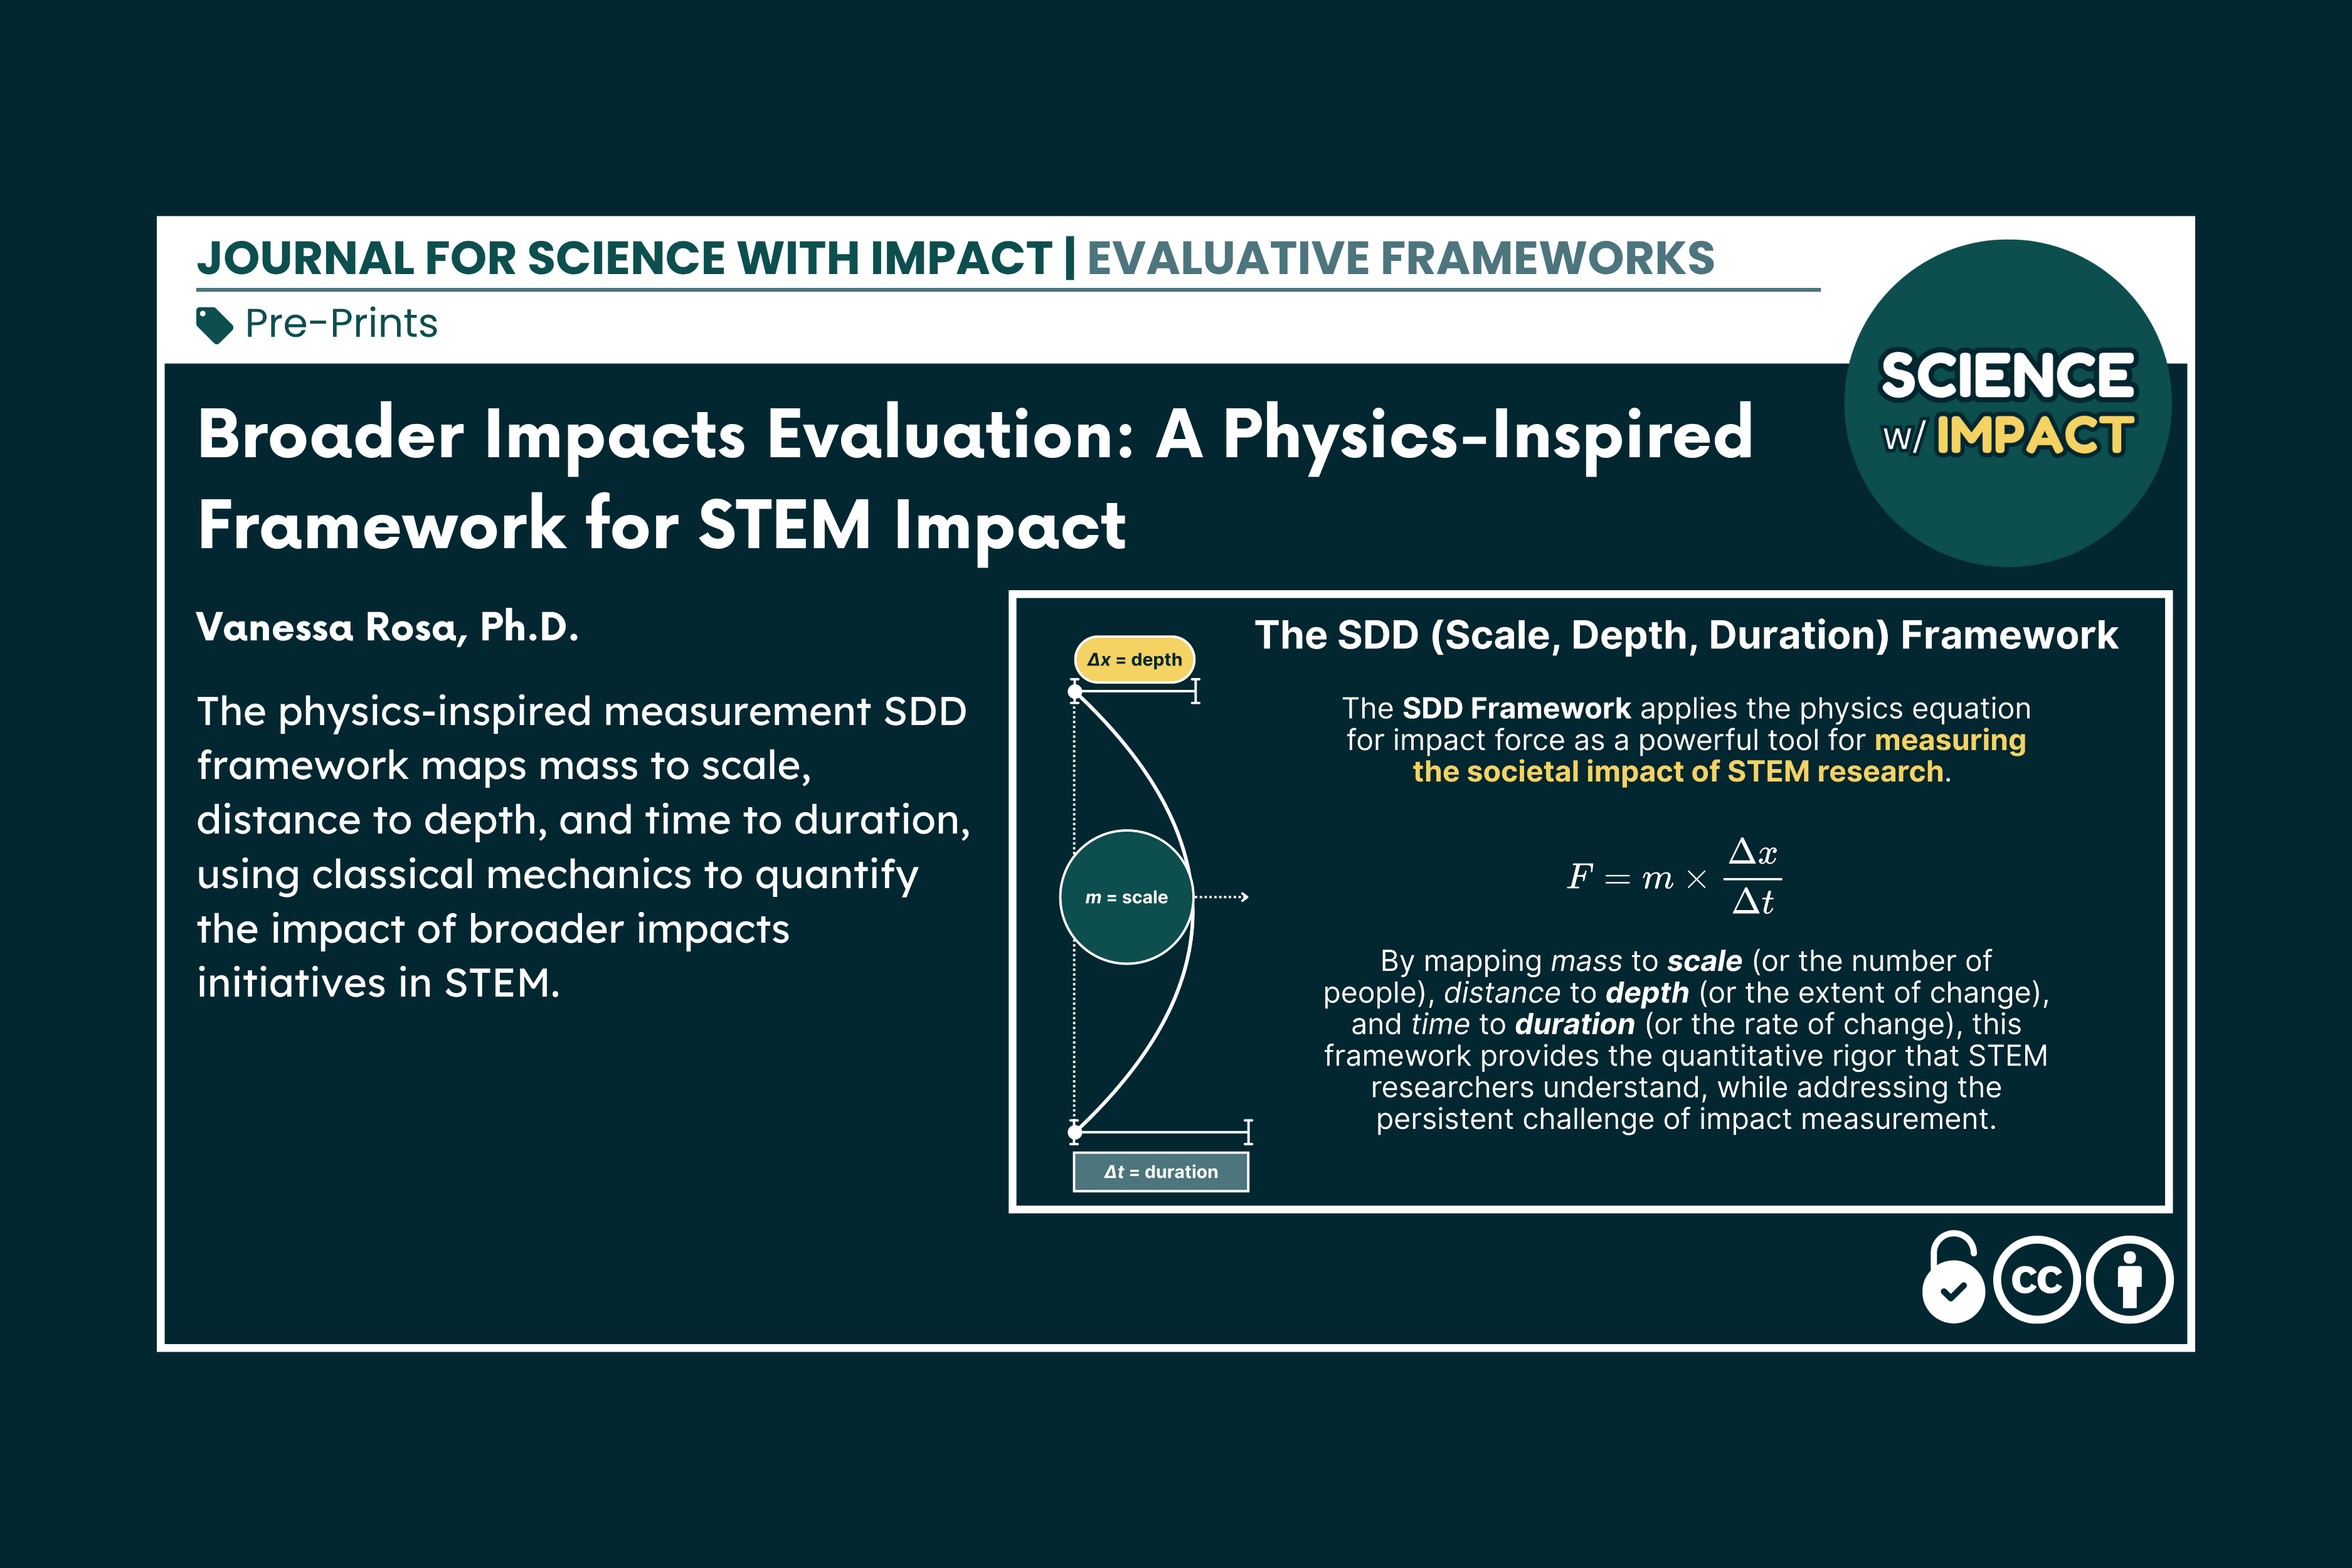
Learn more about the SDD Framework.
Self-Reported Outcomes
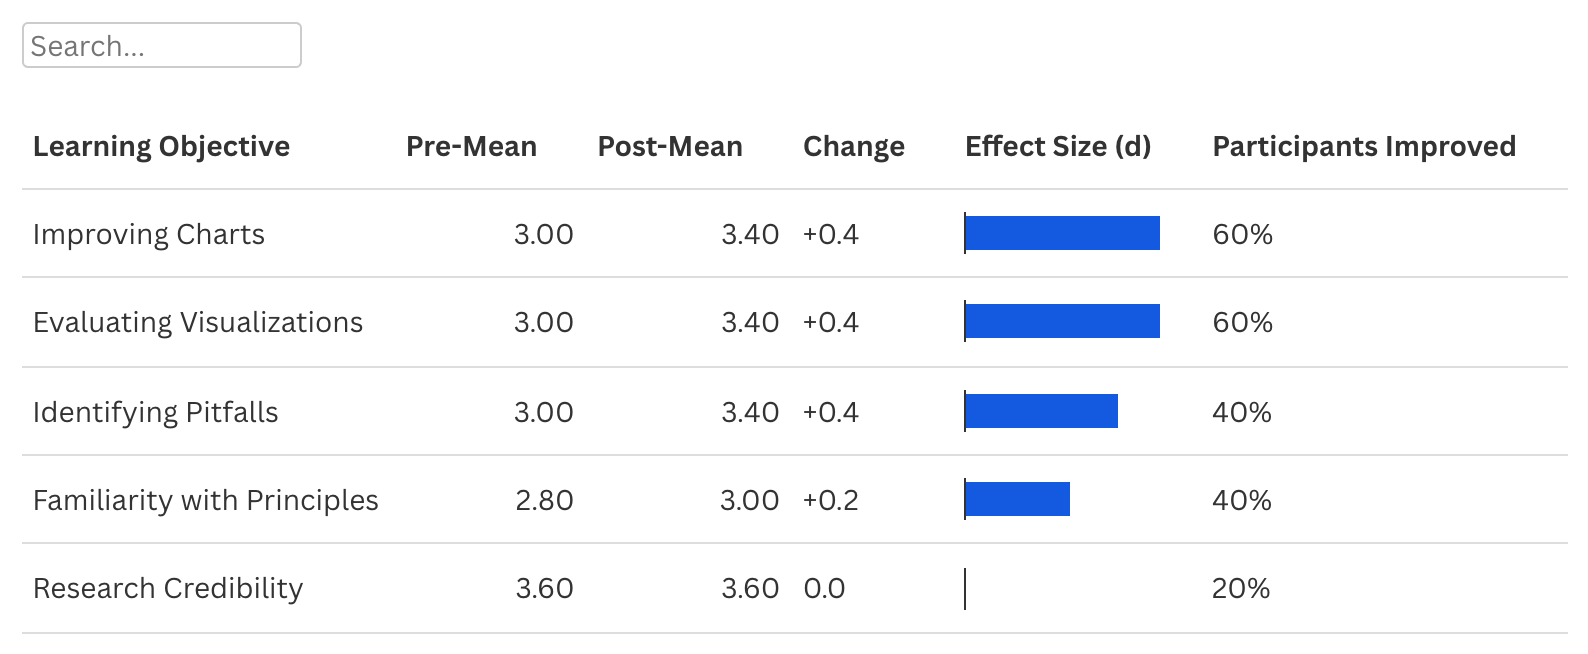
The paired t-test analysis reveals no statistically significant changes in students' self-reported improvements across any of the five learning objectives (all p-values > 0.05). However, effect size analysis using Cohen's d provides a more nuanced picture of learning gains:
Three Key Findings
- Improving Charts and Evaluating Visualizations emerged as the most successful learning objectives, with 60% of participants showing improvement and effect sizes approaching the "medium" threshold (d ≈ 0.45).
- Research Credibility showed no measurable change (d = 0.0), despite starting with the highest baseline scores (3.6/5). This ceiling effect indicates that participants already had a strong understanding of how visualizations enhance research credibility, limiting the growth potential.
- Familiarity with Principles and Identifying Pitfalls showed the most minor gains, indicating these foundational concepts may require more intensive instruction or different pedagogical approaches.
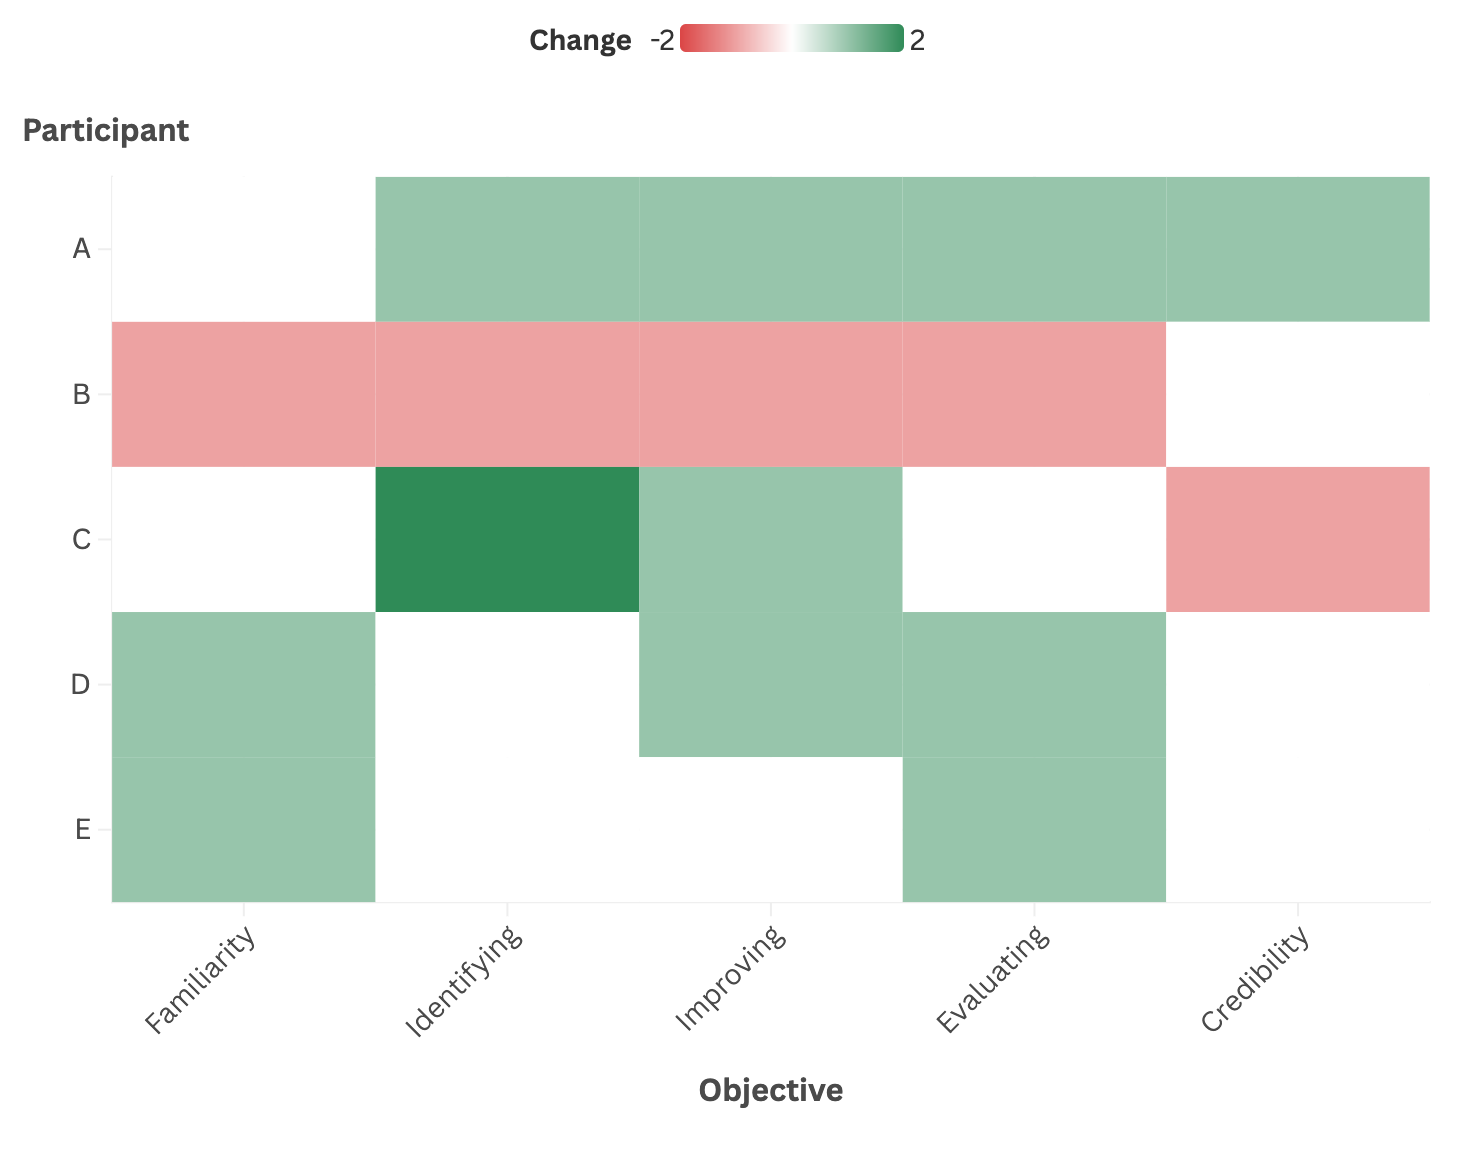
A heatmap analysis reveals significant individual variation in learning outcomes, highlighting the importance of examining participant-level data rather than relying solely on group averages.
Three Key Findings
- Participant C demonstrated the strongest overall gains, improving in three of five areas with a notable 2-point increase in identifying pitfalls.
- Participant B displayed concerning declines across four objectives, indicating that the workshop content may not have aligned with their learning style or that their initial perception of their ability changed.
- Participants A, D, and E showed positive gains in three to four areas, indicating the workshop was effective for the majority of attendees.
This pattern suggests that while group-level statistics show modest gains, most individuals did experience meaningful learning.
Skills Assessment
Pitfall Identification Exercise Performance
The pre-post pitfall identification analysis reveals an interesting pattern of qualitative improvement despite quantitative stability.
In the pre-assessment, participants were asked:
Which three issues most mislead viewers in comparing toxicity by technique using the visualization linked below?
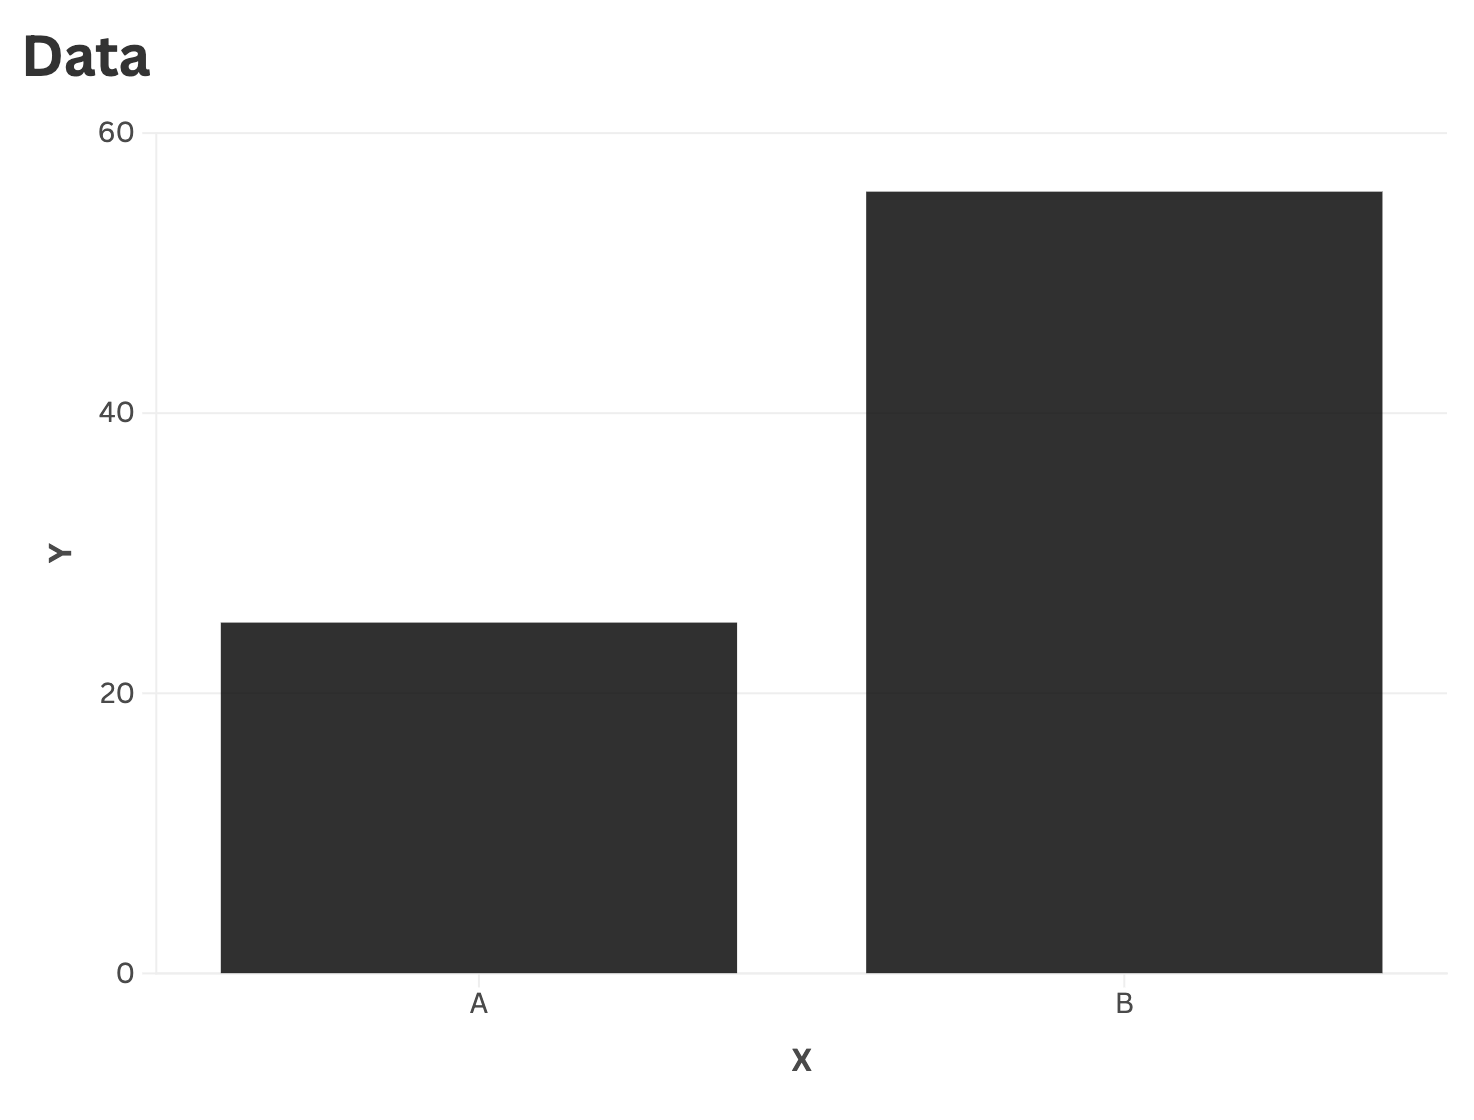
All participants correctly identified three pitfalls (Title and axes are not descriptive, techniques aren't labeled, no units are provided) in the pre-workshop exercise, demonstrating solid baseline knowledge.
Post-workshop, four participants maintained this performance level while one participant (A) identified only two pitfalls, resulting in a slight average decline of -0.2 pitfalls.
Which three issues most mislead viewers in comparing toxicity by technique using the visualization linked below?
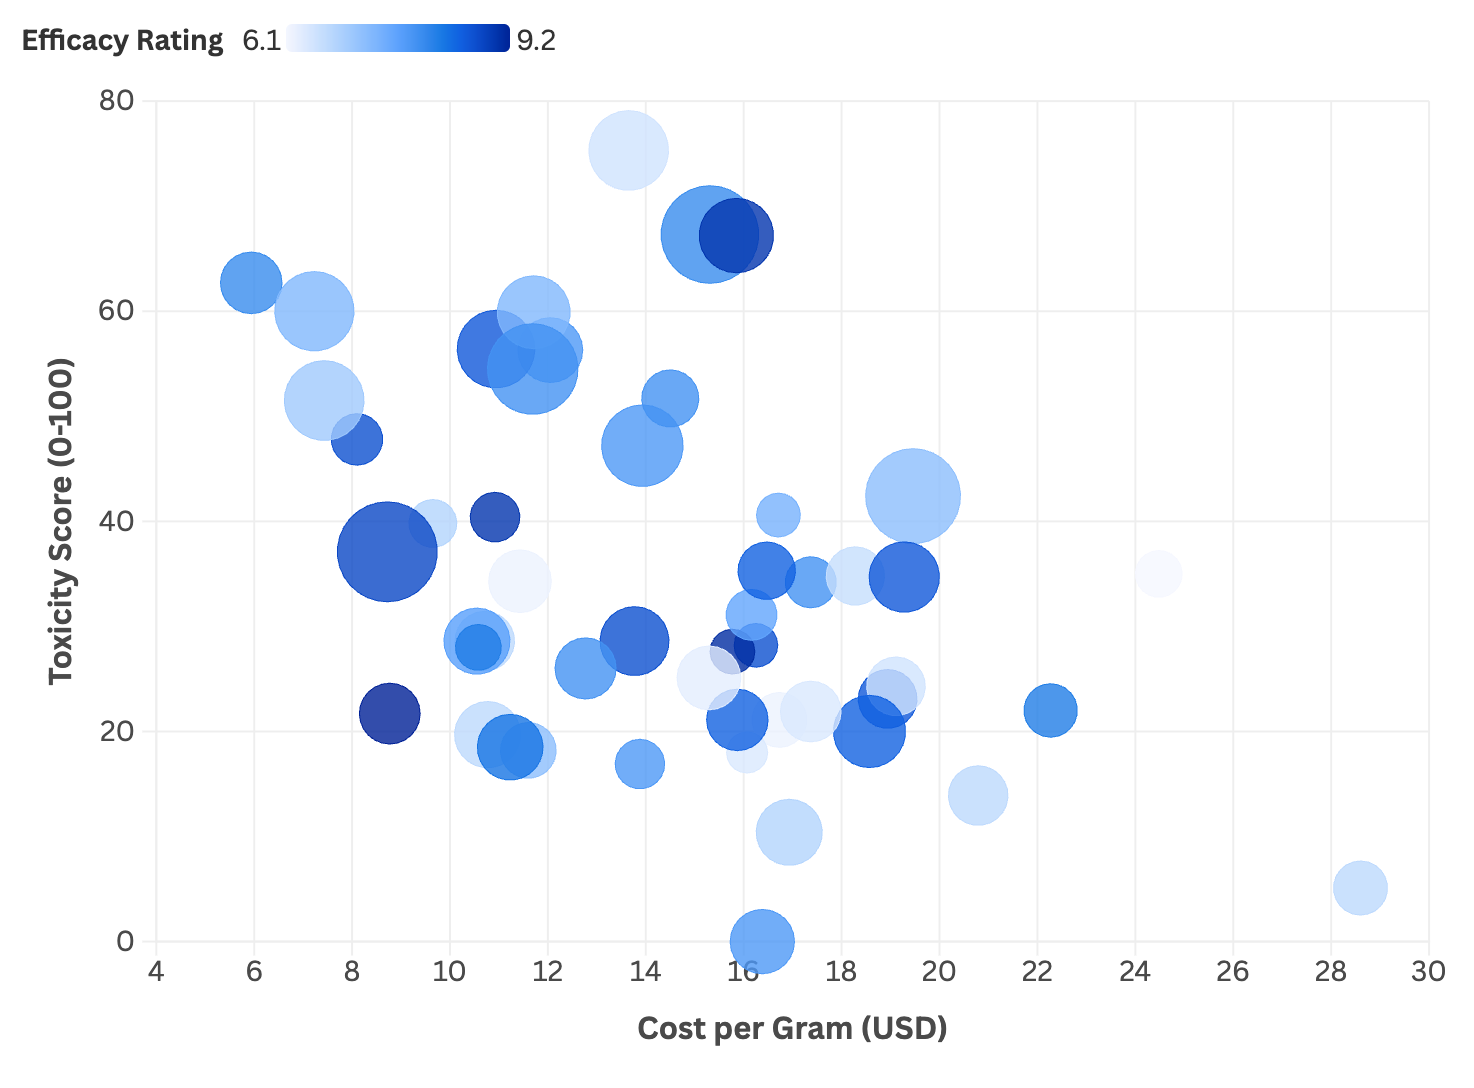
Pre-workshop responses focused on basic labeling and formatting issues ("No units are provided," "Title and axes are not descriptive"), while post-workshop responses demonstrated deeper understanding of visualization design principles.
Participants identified more nuanced problems such as "overlapping points hide individual data patterns," "insufficient context about toxicity scale meaning," and "chart type obscures group comparisons".
This shift indicates that while participants maintained their ability to identify problems, they developed more sophisticated analytical frameworks for understanding why visualizations fail.
Participants' Technical Vocabulary Use
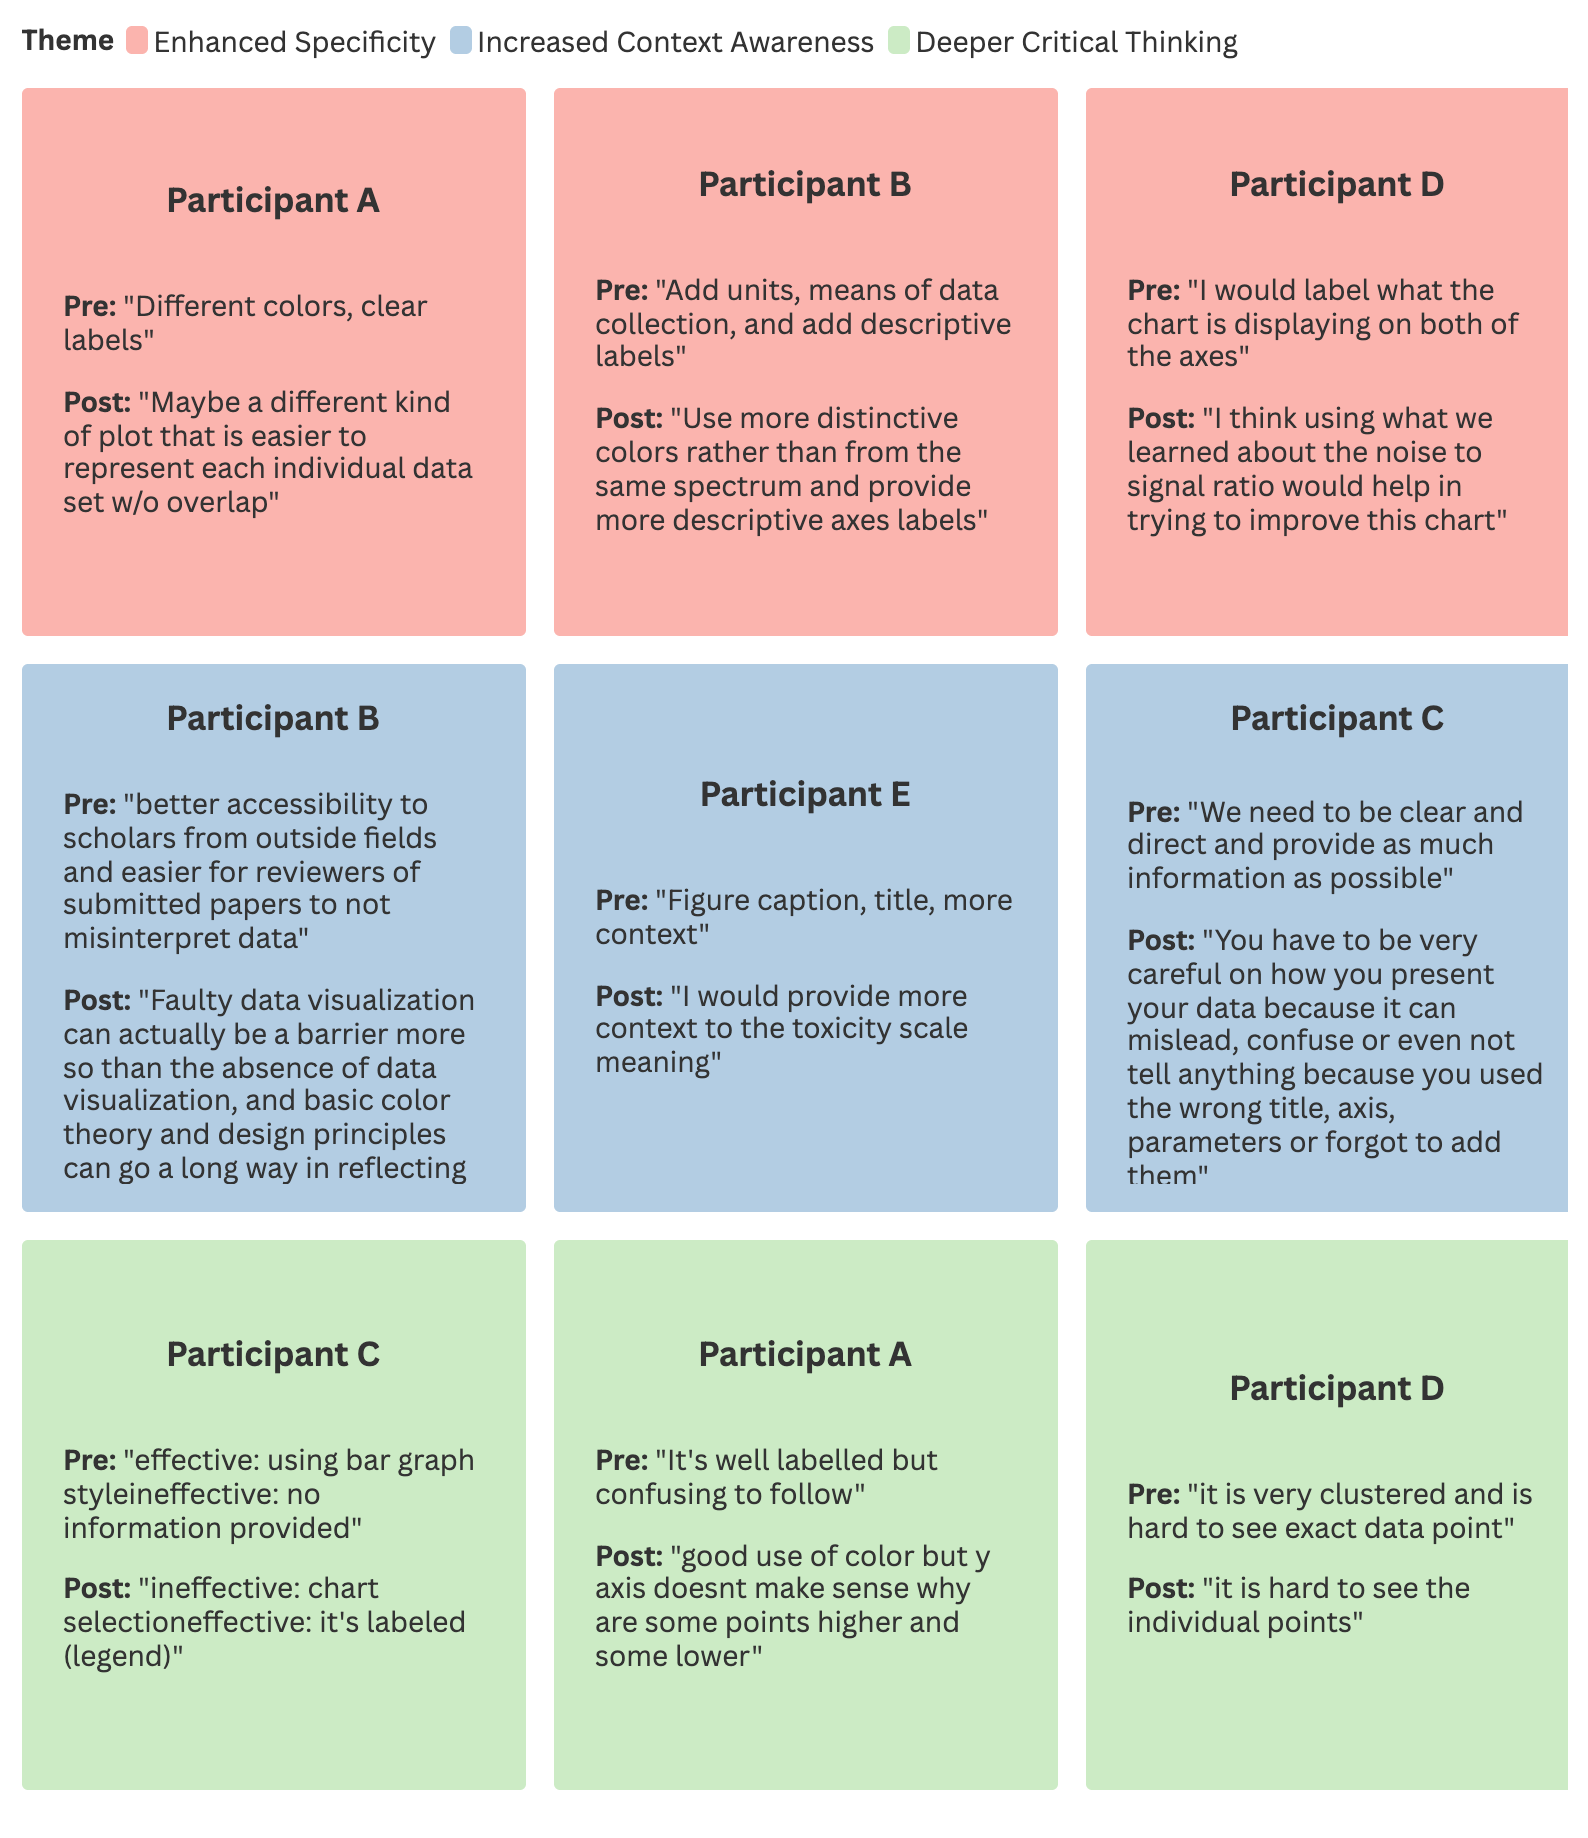
The following table demonstrates how participants evolved from generic feedback to sophisticated, technical analysis through direct quotes from their pre- and post-workshop responses:
Three Key Themes
- Enhanced specificity: Participants moved from generic feedback ("make it clearer") to precise recommendations ("use more distinctive colors rather than from the same spectrum")
- Increased context awareness: Post-workshop responses showed better understanding of audience needs and communication purposes
- Deeper critical thinking: Evidence of evaluative rather than purely descriptive analysis
A Dunning-Kruger Moment: When Declining Confidence Signals Success
Participant B provided our most compelling case study of healthy metacognitive recalibration. Their confidence in identifying pitfalls decreased from 3 to 2 on the 5-point scale, while their qualitative responses demonstrated the strongest growth in technical vocabulary and principle application.
"When they suddenly realize, oh, there's so much more out there, they have more of a grasp of their own level of competence." - Facilitator
This represents the Dunning-Kruger awareness moment—when learning reveals the true scope of one's ignorance, leading to more accurate self-assessment.
Participant B's responses evolved from generic feedback to sophisticated analysis incorporating "color theory" and "design principles," while their feedback praised the workshop's engagement strategy. This paradoxical pattern—decreased confidence paired with increased sophistication—indicates durable learning with metacognitive awareness.
Conclusion
Rather than relying on single metrics, we employed a holistic success framework requiring participants to meet at least two of three comprehensive criteria:
- quantitative pitfall identification,
- qualitative technical vocabulary adoption, principle application, or structured evaluation framework usage, and
- confidence calibration (qualitative and qualitative triangulation).
Remarkably, the workshop achieved 80% holistic success, with four of five participants demonstrating multi-dimensional learning gains that ranged from Participant D's complete mastery across all criteria to Participant A's perfectly calibrated self-assessment despite limited skill development.
Participant feedback powerfully validated our analytical findings, with universal appreciation for the interactive format:
"I appreciate the effort to make the audience more engaging" - Participant B
And consistent requests for extended duration:
"More time" - Participant C
"...we were short on time." - Participant D
I think we could have used a little more time, but I liked how interactive it was. - Participant E
—precisely echoing our conclusions about time constraints limiting deeper integration.
This workshop succeeded not by ensuring every participant mastered every skill, but by creating differentiated foundations for continued growth while preventing the overconfidence that impedes learning—a sophisticated pedagogical achievement that transforms brief educational interventions into catalysts for sustained development.
The achievement of a 80% threshold, combined with rich qualitative evidence of analytical sophistication, demonstrates that meaningful learning can occur even within significant time constraints when instruction is carefully designed to meet learners where they are and guide them toward more sophisticated understanding.
Ready to Improve Research Training Evaluation?
The evidence is clear: traditional evaluation methods aren't capturing the full picture of learning and impact. This case study demonstrates what becomes possible when we move beyond satisfaction surveys and participant counts to rigorous, evidence-based assessment that reveals the true dynamics of professional development.
Whether you're planning your next workshop series or need comprehensive evaluation of existing programs, our team brings the proven methodology behind this 80% success story directly to your research training challenges. We've transformed the guesswork of educational impact into precise, actionable insights using our physics-inspired SDD Framework and holistic assessment approach.
Linked here is a recording of the session!
Two Ways to Get Started:
🎯 Need Evaluation or Program Development?
Get the expertise that transforms good intentions into proven results. Our rigorous assessment methodology provides the actionable insights you need to optimize learning outcomes, demonstrate impact to funders, and create truly effective professional development experiences.
💡 Support Breakthrough Educational Research
This innovative evaluation methodology exists because our nonprofit can focus on advancing the field rather than chasing funding. Your support enables us to develop more frameworks like SDD, conduct deeper research, and share proven methods that transform how we train the next generation of researchers.
Don't let another professional development opportunity pass without knowing its true impact. Contact us today to discuss how evidence-based evaluation can revolutionize your research training programs and provide the accountability your stakeholders demand.
Ready to move beyond guesswork? Let's create measurable, meaningful change together.


Member discussion